简体中文
繁體中文
English
Pусский
日本語
ภาษาไทย
Tiếng Việt
Bahasa Indonesia
Español
हिन्दी
Filippiiniläinen
Français
Deutsch
Português
Türkçe
한국어
العربية
USD/SEK, USD/NOK Break Through Key Support - Whats Next?
Lời nói đầu:USD/SEK and USD/NOK broke through key support levels as US Dollar strength faded and short-term volatility is to be expected from central bank-related event risk this week.
NORDIC FX, SEK, NOK - WEEKLY MARKET OUTLOOK
USD/SEK, USD/NOK broke key support levels
Broader trajectory for pairs remains on upside
FOMC, Norges Bank likely to cause volatility
See our free guide to learn how to use economic news in your trading strategy!
SWEDISH KRONA TECHNICAL ANALYSIS
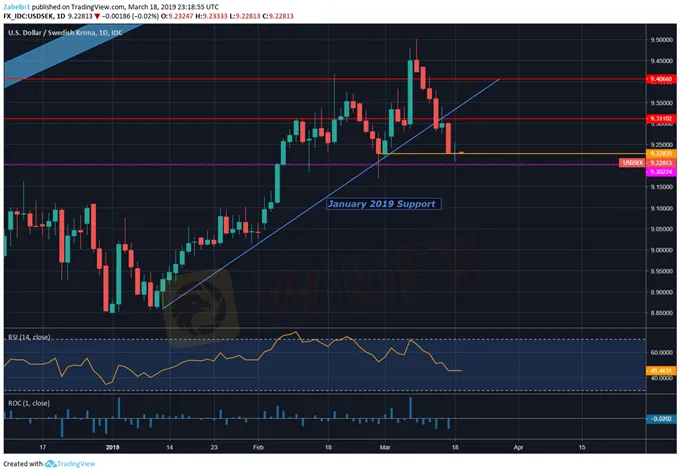
Last week, US Dollar weakness appeared to have been the catalyst in dragging down USD/SEK below the January 2019 rising support line. The pair is now sitting on the frequently-tested 9.2283 support. Another bounce from this level might show that overall sentiment for the pair still remains broadly bullish. The pairs aim may now be on breaching resistance at 9.3110 and using that as the new floor if prices turn lower again.
USD/SEK – Daily Chart
Zooming out, the pairs overall trajectory since the start of 2018 has showed a broad uptrend. The January 2018 support provided a strong foundation for the pair to ride on until its break in September. USD/SEK then broke into consolidation before trying to re-enter the rising support range from the beginning of 2018. However, underlying momentum failed to push the pair through it. What followed was a congestive period of indecision.
However, in 2019, the pair resumed its previous upward trajectory, and went on to achieve a 17-year high in early March. USD/SEKs atmosphere-puncturing rise was subsequently faded as negative RSI divergence illustrated ebbing upward momentum and US Dollar weakness prevailed. Despite a small pullback, fundamental factors suggest the pair will continue to climb.
USD/SEK – Daily Chart
NORWEGIAN KRONE TECHNICAL ANALYSIS
USD/NOK also recently broke through a key support level in what also appears to be the result of broad US Dollar weakness. The pair‘s descent looks to have been abruptly ended after bouncing back from the familiar support at 8.5261, a strong psychological floor. The pair’s aim may be to first re-enter the 8.5956-8.6323 resistance range before maybe resuming its previous incline.
USD/NOK – Daily Chart
Like USD/SEK, USD/NOK appears to be only having a small pullback from what looks like a broader uptrend originally starting from the sharp incline in September 2018. The pair broke through in early-January but then promptly resumed the previous uptrend at a less aggressive pace. The pair will likely continue to climb through the rest of the week, but central bank-related events may cause short-term volatility as markets price in a new outlook.
USD/SEK – Daily Chart
Miễn trừ trách nhiệm:
Các ý kiến trong bài viết này chỉ thể hiện quan điểm cá nhân của tác giả và không phải lời khuyên đầu tư. Thông tin trong bài viết mang tính tham khảo và không đảm bảo tính chính xác tuyệt đối. Nền tảng không chịu trách nhiệm cho bất kỳ quyết định đầu tư nào được đưa ra dựa trên nội dung này.
Sàn môi giới
GO Markets
KVB
Neex
FOREX.com
GTCFX
Trive
GO Markets
KVB
Neex
FOREX.com
GTCFX
Trive
Sàn môi giới
GO Markets
KVB
Neex
FOREX.com
GTCFX
Trive
GO Markets
KVB
Neex
FOREX.com
GTCFX
Trive
Tin HOT
Bình yên giả tạo? Fed có đang đánh cược với lạm phát?
Nổi tiếng nhưng nhiều 'phốt'? Bạn có nên tin tưởng 3 sàn môi giới này?
WikiFX cảnh báo sàn Forex FIBO Group: Sàn 'ôm lệnh, khóa rút tiền', bị thu hồi giấy phép
“Rút êm” gần 200 triệu USD khỏi dự án tiền số: Gia đình quyền lực nhất thế giới toan tính gì?
InterStellar là sàn nào? Có thực sự 'an toàn'?
Đầu tư lợi nhuận “khủng”? Coi chừng bạn đang đổ tiền vào cái bẫy khổng lồ!
WikiFX cung cấp dịch vụ hỗ trợ miễn phí nhằm bảo vệ quyền lợi hợp pháp cho nhà đầu tư
Điểm danh 5 lý do khiến FCA "trảm" hàng loạt sàn Forex
Top 3 sàn môi giới có phí giao dịch qua đêm thấp nhất tháng 06/2025
Lật tẩy “đế chế lừa đảo tài chính” chiếm đoạt hơn 11 tỷ đồng qua sàn chứng khoán ảo!
Tính tỷ giá hối đoái


