简体中文
繁體中文
English
Pусский
日本語
ภาษาไทย
Tiếng Việt
Bahasa Indonesia
Español
हिन्दी
Filippiiniläinen
Français
Deutsch
Português
Türkçe
한국어
العربية
FPG GBPUSD Market Report August 7, 2025
Sommario:The GBPUSD daily chart shows that the pair has been under sustained selling pressure after failing to hold above the 1.3589 resistance level. Price action has recently rebounded from the 1.3142 suppor
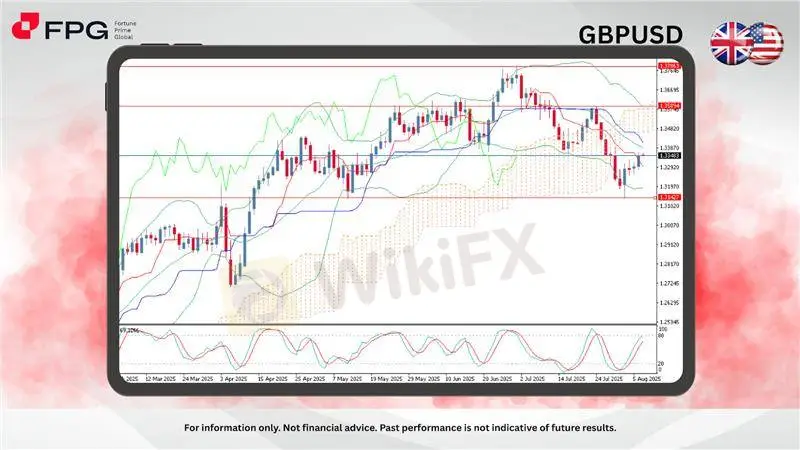
The GBPUSD daily chart shows that the pair has been under sustained selling pressure after failing to hold above the 1.3589 resistance level. Price action has recently rebounded from the 1.3142 support, suggesting that buyers are attempting to regain control, but the overall trend remains cautious. The Ichimoku Cloud indicates that the pair is currently trading below the cloud, signaling a prevailing bearish bias. Additionally, the lower Bollinger Band acted as dynamic support, while the mid-band is now serving as immediate resistance near the 1.3387 area.
Momentum indicators provide further insights into market sentiment. The Stochastic Oscillator has recently crossed upward from the oversold zone, hinting at a short-term corrective rally. However, the overall structure remains fragile as long as the price is capped below the key resistance levels. A decisive break above 1.3387 could open the door for a retest of 1.3589, while a rejection from this zone may trigger another downward move back toward the 1.3142 support level.
From a broader perspective, the market appears to be in a consolidation phase following a previous sharp decline. Traders should monitor how the price reacts around the current mid-range zone, as it will likely determine the next directional move. A successful bullish breakout could shift short-term momentum toward the upside, but failure to sustain above the mid-resistance area may encourage sellers to resume the downtrend. Until a clear breakout occurs, GBPUSD is expected to trade within the 1.3142–1.3589 range, with cautious sentiment dominating the market.
Market Observation & Strategy Advice:
1. Current Position: GBPUSD is trading around 1.3348, bouncing from the recent low near 1.3142, but still below the mid-range resistance, indicating a tentative recovery within a broader downtrend.
2. Resistance: Immediate resistance lies at 1.3387, with a stronger resistance zone near 1.3589, where previous attempts to break higher failed.
3. Support: Key support is seen at 1.3142, aligned with the lower price cluster and recent swing lows.
4. Indicators: The Stochastic Oscillator (5,3,3) is turning upward from the oversold region, suggesting a short-term corrective rally, while price remains below the Ichimoku Cloud, reflecting an overall bearish bias. Bollinger Bands show price moving toward the mid-band, which may act as dynamic resistance.
5. Trading Strategy Suggestions:
Short-Term: Traders may consider selling on rejection below 1.3387, targeting a pullback toward 1.3200–1.3140.
Wait for Breakout: Conservative buyers may wait for a confirmed breakout above 1.3387 to target 1.3589.
Risk Management: Tight risk management is advised due to the current corrective phase against the prevailing downtrend.
Market Performance:
Forex Last Price % Change
EUR/USD 1.16528 −0.05%
USD/JPY 147.421 +0.05%
Today's Key Economic Calendar:
AU: Balance of Trade
CN: Balance of Trade
CN: Exports & Imports YoY
DE: Balance of Trade
UK: BoE Interest Rate Decision
CA: Ivey PMI s.a
Risk Disclaimer This report is for informational purposes only and does not constitute financial advice. Investments involve risks, and past performance does not guarantee future results. Consult your financial advisor for personalized investment strategies.
Disclaimer:
Le opinioni di questo articolo rappresentano solo le opinioni personali dell’autore e non costituiscono consulenza in materia di investimenti per questa piattaforma. La piattaforma non garantisce l’accuratezza, la completezza e la tempestività delle informazioni relative all’articolo, né è responsabile delle perdite causate dall’uso o dall’affidamento delle informazioni relative all’articolo.
WikiFX Trader
FBS
FXTM
TMGM
IronFX
Exness
EC Markets
FBS
FXTM
TMGM
IronFX
Exness
EC Markets
WikiFX Trader
FBS
FXTM
TMGM
IronFX
Exness
EC Markets
FBS
FXTM
TMGM
IronFX
Exness
EC Markets
Rate Calc

