简体中文
繁體中文
English
Pусский
日本語
ภาษาไทย
Tiếng Việt
Bahasa Indonesia
Español
हिन्दी
Filippiiniläinen
Français
Deutsch
Português
Türkçe
한국어
العربية
Dollar Weakens Further as Fed Rate Cut Bets Rise; Wall Street Rallies on Tariff-Driven Tech Boost
Sommario:Key Takeaways:*The U.S. dollar index slipped to a near two-week low, pressured by renewed trade tensions and rising expectations of a Fed rate cut in September.*A proposed 100% tariff on semiconductor
Key Takeaways:
*The U.S. dollar index slipped to a near two-week low, pressured by renewed trade tensions and rising expectations of a Fed rate cut in September.
*A proposed 100% tariff on semiconductor chip imports has stoked fears of escalating U.S. protectionism, weighing on the greenback.
*U.S. equities surged, led by strong gains in tech stocks like Apple and Tesla, amid hopes for a revival in domestic chip manufacturing.
Market Summary:
The U.S. dollar remained under pressure, with the dollar index falling to its lowest level in nearly two weeks as markets grappled with renewed trade uncertainty and shifting expectations for Federal Reserve policy. The index‘s sustained decline—now approaching a critical support zone near 97.85—reflects growing bearish momentum following last week’s sharp selloff.
Trade Tensions Resurface
Investor concerns over escalating protectionism flared after President Trump floated the possibility of a 100% tariff on semiconductor chip imports, a move that could disrupt global supply chains and intensify trade disputes. The proposal, seen as part of a broader push to reshore critical manufacturing, has injected fresh volatility into currency markets while paradoxically boosting U.S. tech stocks on expectations of increased domestic production.
Fed Policy in Focus
The dollar‘s weakness has been compounded by evolving interest rate expectations, with markets increasingly convinced the Federal Reserve will cut rates in September following its dovish-leaning July meeting. Traders now await next week’s U.S. CPI data for confirmation of disinflationary trends that could reinforce the case for monetary easing.
Equities Rally on Reshoring Optimism
While the dollar struggled, Wall Street rallied sharply as the administrations semiconductor push energized tech shares. Apple surged over 5% and Tesla gained more than 3%, leading a broad-based advance that lifted major indices. The divergent performance between the dollar and equities underscores how trade policies are creating both winners and losers across asset classes—with manufacturers facing tariff risks while domestic-focused tech firms benefit from reshoring initiatives.
As the dollar tests key technical levels, its near-term trajectory will likely hinge on whether upcoming inflation data validates the markets dovish Fed expectations and whether the semiconductor tariff proposal evolves from rhetoric to reality. The contrasting reactions across currency and equity markets highlight the complex interplay between trade policy, monetary expectations, and sector-specific fundamentals in shaping current price action.
Technical Analysis
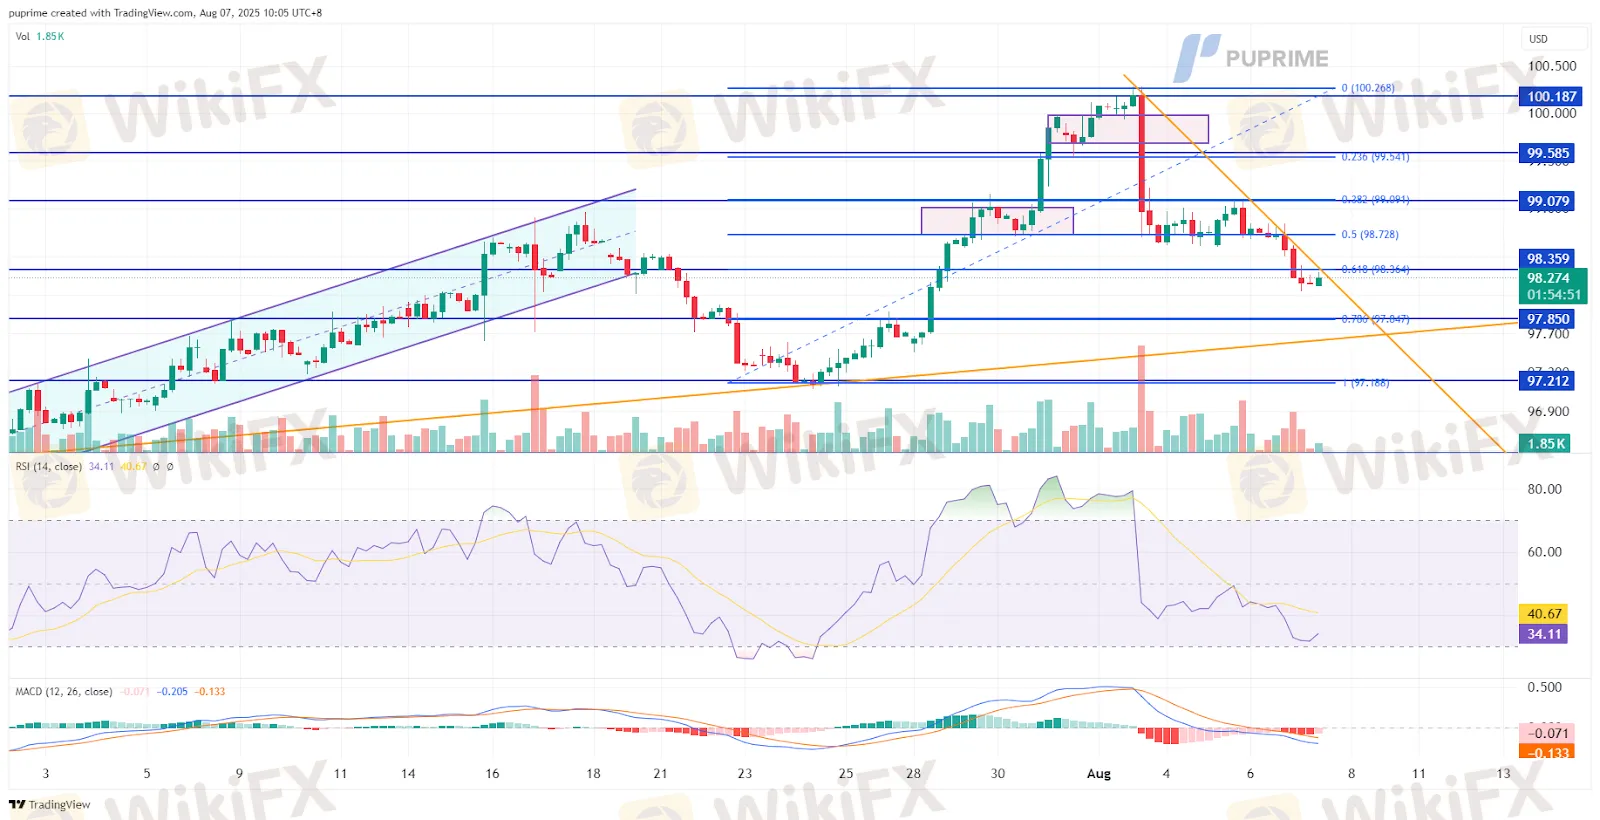
DXY, H4:
The U.S. dollar index extended its decline after failing to consolidate recent losses, slipping below its established range and confirming a bearish breakout. The move below the critical 68.2% Fibonacci retracement level at 98.35 further underscores the downside bias, reinforcing the view that the index is under sustained selling pressure.
Momentum indicators support the bearish outlook. The Relative Strength Index (RSI) is nearing oversold territory, while the Moving Average Convergence Divergence (MACD) is poised to cross below the zero line—both signaling intensifying downside momentum.
Unless the index can regain ground above the breached Fibonacci level, the current trajectory suggests the dollar could remain on the defensive in the near term.
Resistance level: 99.10, 99.60
Support level: 97.85, 97.20
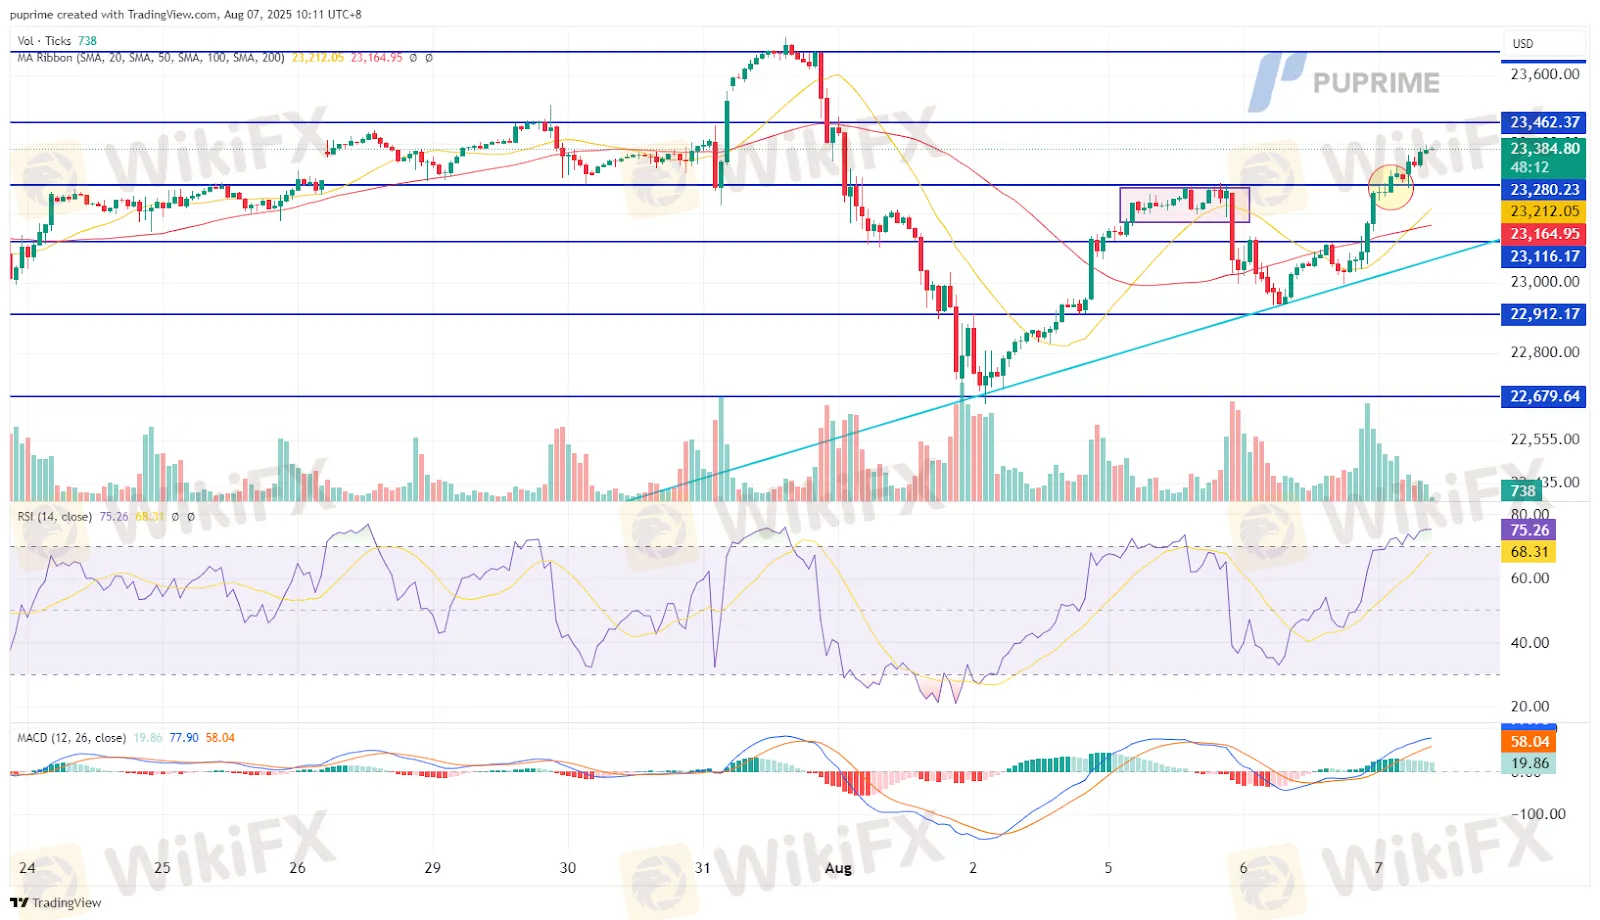
Nasdaq, H1:
The tech-heavy Nasdaq index continues to trade in a higher-low formation, with a decisive breakout above the key resistance level at 23,280 signaling strong bullish momentum. A sustained move above the immediate resistance at 23,465 could pave the way for a retest of the indexs all-time high at 23,685.
Momentum indicators reinforce the bullish narrative. The Relative Strength Index (RSI) has entered overbought territory, reflecting strong buying interest. Meanwhile, the MACD has climbed further above the zero line, confirming upward momentum and suggesting that the rally may have further room to run.
Resistance level: 23,465.00, 23,685.00
Support level: 23,280.00, 23,115.00
Disclaimer:
Le opinioni di questo articolo rappresentano solo le opinioni personali dell’autore e non costituiscono consulenza in materia di investimenti per questa piattaforma. La piattaforma non garantisce l’accuratezza, la completezza e la tempestività delle informazioni relative all’articolo, né è responsabile delle perdite causate dall’uso o dall’affidamento delle informazioni relative all’articolo.
WikiFX Trader
IronFX
IB
GTCFX
STARTRADER
KVB
FOREX.com
IronFX
IB
GTCFX
STARTRADER
KVB
FOREX.com
WikiFX Trader
IronFX
IB
GTCFX
STARTRADER
KVB
FOREX.com
IronFX
IB
GTCFX
STARTRADER
KVB
FOREX.com
Rate Calc

