简体中文
繁體中文
English
Pусский
日本語
ภาษาไทย
Tiếng Việt
Bahasa Indonesia
Español
हिन्दी
Filippiiniläinen
Français
Deutsch
Português
Türkçe
한국어
العربية
U.S. Trade Deficit Continues to Narrow; Uptrend in the Dollar Index Remains Intact
Sommario:The U.S. overall trade deficit narrowed by 16% in June to $60.2 billion, down from the revised $71.7 billion in May. Imports fell 3.7% to $337.5 billion, while exports slipped 0.5% to $277.3 billion.
The U.S. overall trade deficit narrowed by 16% in June to $60.2 billion, down from the revised $71.7 billion in May. Imports fell 3.7% to $337.5 billion, while exports slipped 0.5% to $277.3 billion. Despite the drop in both imports and exports, the significant narrowing of the deficit is generally considered bullish for the U.S. Dollar Index.
The reasoning ties back to the GDP formula: GDP = Consumption + Investment + Government Spending + (Exports − Imports). A shrinking trade deficit contributes positively to GDP growth.
While near-term sentiment remains dominated by expectations for rate cuts, we believe monetary policy will only slow the dollars upward momentum, not reverse its medium- to long-term uptrend.
")
(Chart 1: U.S. Trade Deficit – June; Source: JIN10 Data)
Looking at Julys ISM Services NMI, the index came in at 50.1, below the prior 50.8, signaling softer service-sector activity compared to June.
Breakdown of the five key NMI components:
Business Activity: 54.2 → 52.6 (−1.6)
New Orders: 51.3 → 50.3 (−1.0)
Employment: 47.2 → 46.4 (−0.8) – remaining in contraction
Supplier Deliveries: 50.3 → 51.0 (+0.7) – inverse indicator
Inventories: 52.7 → 51.8 (−0.9)
Although the service sector slowed from last month, it still shows signs of expansion.
Looking at supplier deliveries, input prices, and order backlogs together:
Input Prices: 67.5 → 69.9
Backlog of Orders: 42.4 → 44.3
Combined with slower supplier deliveries, this indicates underlying demand has not disappeared. Seasonally, services remain relatively resilient compared to manufacturing PMI, supporting the U.S. economys foundation.
However, survey responses point to concerns about excess inventory levels relative to current sales conditions.
")
(Chart 2: ISM Services NMI – July; Source: ISM Report)
Slowing end-market sales will be a key challenge for the global economy in the second half of the year. This is not solely due to tariffs; it is also linked to the economic cycle shifting from expansion to peak, with declining disposable income and savings rates weighing on consumption.
Many consumers have already completed major purchases, and with the savings rate at a relatively low 4.5%, cooling demand may push risk assets into a corrective phase.
Both nonfarm payrolls and ISM PMI & NMI indicate weaker hiring momentum, signaling a labor market cooling from solid growth. The Fed is likely to pair a more accommodative monetary stance with lower business financing costs and reduced household debt burdens. As savings recover over the next 1–2 quarters, equity markets could regain bullish momentum.
From a market risk perspective, one potential headwind lies in the Treasurys Q3 debt issuance, which could absorb substantial liquidity. Beyond slowing consumer demand, tighter liquidity could be another catalyst for equity downside.
Gold Technical Analysis
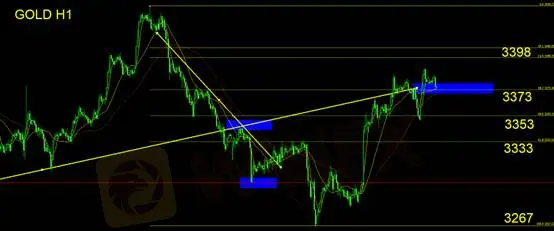
Yesterdays technical outlook suggested the move above 3,373 during the Asia session was a false breakout. Price then pulled back to the 3,353 area, held support, and retested above 3,373, peaking at 3,390. Price action has since returned to the 3,373 level.
We continue to believe that, with the dollar indexs uptrend intact, the break above 3,373 is a false breakout. We recommend staying on the sidelines for now and only considering short positions if the daily candle confirms a reversal with a close lower.
Stop Loss: $20
Support Levels: 3,373 / 3,353 / 3,333 / 3,367
Resistance Level: 3,398
Risk Disclaimer: The above views, analysis, research, prices, and other information are provided for general market commentary only and do not represent the views of this platform. All readers are responsible for their own trading decisions. Please trade cautiously.
Disclaimer:
Le opinioni di questo articolo rappresentano solo le opinioni personali dell’autore e non costituiscono consulenza in materia di investimenti per questa piattaforma. La piattaforma non garantisce l’accuratezza, la completezza e la tempestività delle informazioni relative all’articolo, né è responsabile delle perdite causate dall’uso o dall’affidamento delle informazioni relative all’articolo.
WikiFX Trader
XM
AvaTrade
FOREX.com
FXCM
GTCFX
FXTRADING.com
XM
AvaTrade
FOREX.com
FXCM
GTCFX
FXTRADING.com
WikiFX Trader
XM
AvaTrade
FOREX.com
FXCM
GTCFX
FXTRADING.com
XM
AvaTrade
FOREX.com
FXCM
GTCFX
FXTRADING.com
Rate Calc

