简体中文
繁體中文
English
Pусский
日本語
ภาษาไทย
Tiếng Việt
Bahasa Indonesia
Español
हिन्दी
Filippiiniläinen
Français
Deutsch
Português
Türkçe
한국어
العربية
Dollar Under Pressure Amid Tariff Escalations and Weak Labor Data
Abstract:Key Takeaways:*Trump imposed an additional 25% tariff on Indian goods over its Russian oil imports, while proposing a 100% tariff on chip imports—fueling concerns about U.S. trade unpredictability.*Re
Key Takeaways:
*Trump imposed an additional 25% tariff on Indian goods over its Russian oil imports, while proposing a 100% tariff on chip imports—fueling concerns about U.S. trade unpredictability.
*Renewed pressure on Russia ahead of the August 8 ceasefire deadline set by Trump and threats of secondary sanctions have added to global uncertainty.
*U.S. jobless claims hit a post-2021 high at 1.974 million, supporting expectations for a Fed rate cut in September and dragging the dollar lower.
Market Summary:
In the latest session, market sentiment was dominated by geopolitical and trade tensions as former President Trump ramped up punitive tariffs on India, drawing fresh scrutiny over the U.S. dollar‘s stability. The decision came in response to India’s continued purchase of Russian oil, with an additional 25% tariff imposed on Indian goods, following the earlier 25% levy effective from August 1. This escalation, coupled with the White House's broader tariff threats—including a proposed 100% tariff on semiconductor imports—has sparked market concerns over the predictability of U.S. trade policy.
The uncertainty surrounding U.S. international relations was further compounded by Trumps renewed pressure on Russia to agree to a ceasefire in Ukraine. As the 50-day ceasefire deadline approaches on August 8, Trump threatened fresh sanctions on Russia and warned of potential secondary sanctions on countries still engaging in Russian energy trade. These geopolitical risks have dented investor confidence, contributing to weakness in the U.S. dollar.
Reflecting the broader anxiety, the U.S. Dollar Index continued to hover near its August lows. Sentiment was further dampened by the latest U.S. labor data, which showed continuing jobless claims rising to 1.974 million—the highest since 2021. The soft labor market print has reinforced market expectations for a Fed rate cut in September, further weighing on the greenback.
Technical Analysis
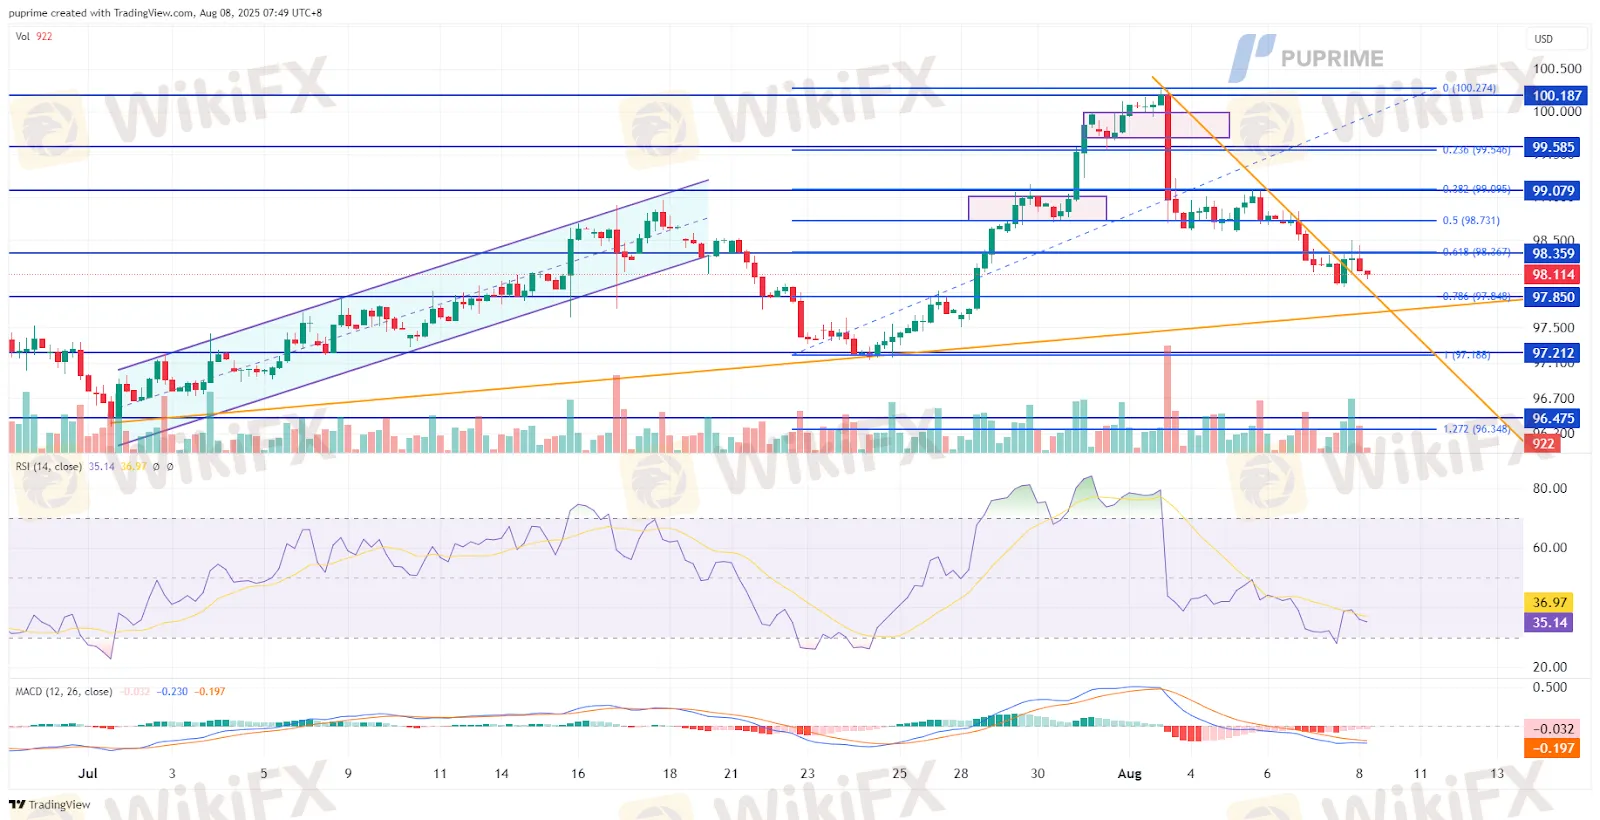
DXY, H4:
The U.S. Dollar Index staged a modest rebound in the previous session, yet remained capped below the 68.2% Fibonacci retracement level at 98.36—a critical threshold that previously defined its bullish structure. The failure to reclaim this level signals a structural breakdown, reinforcing a bearish bias for the greenback.
Adding to the downside pressure, a Doji candlestick pattern formed on the H4 chart near the 98.36 resistance, followed by a decline that completed an Evening Star formation—both classical bearish reversal signals.
Momentum indicators align with the weakening technical backdrop. The Relative Strength Index (RSI) is hovering just above the oversold territory and appears poised to dip further, while the MACD has crossed below the zero line and is trending lower, suggesting increasing downside momentum.
Unless the dollar index can reclaim the 98.36 level decisively, bearish sentiment is likely to persist in the near term.
Resistance level: 98.36, 99.10
Support level: 97.20, 96.50
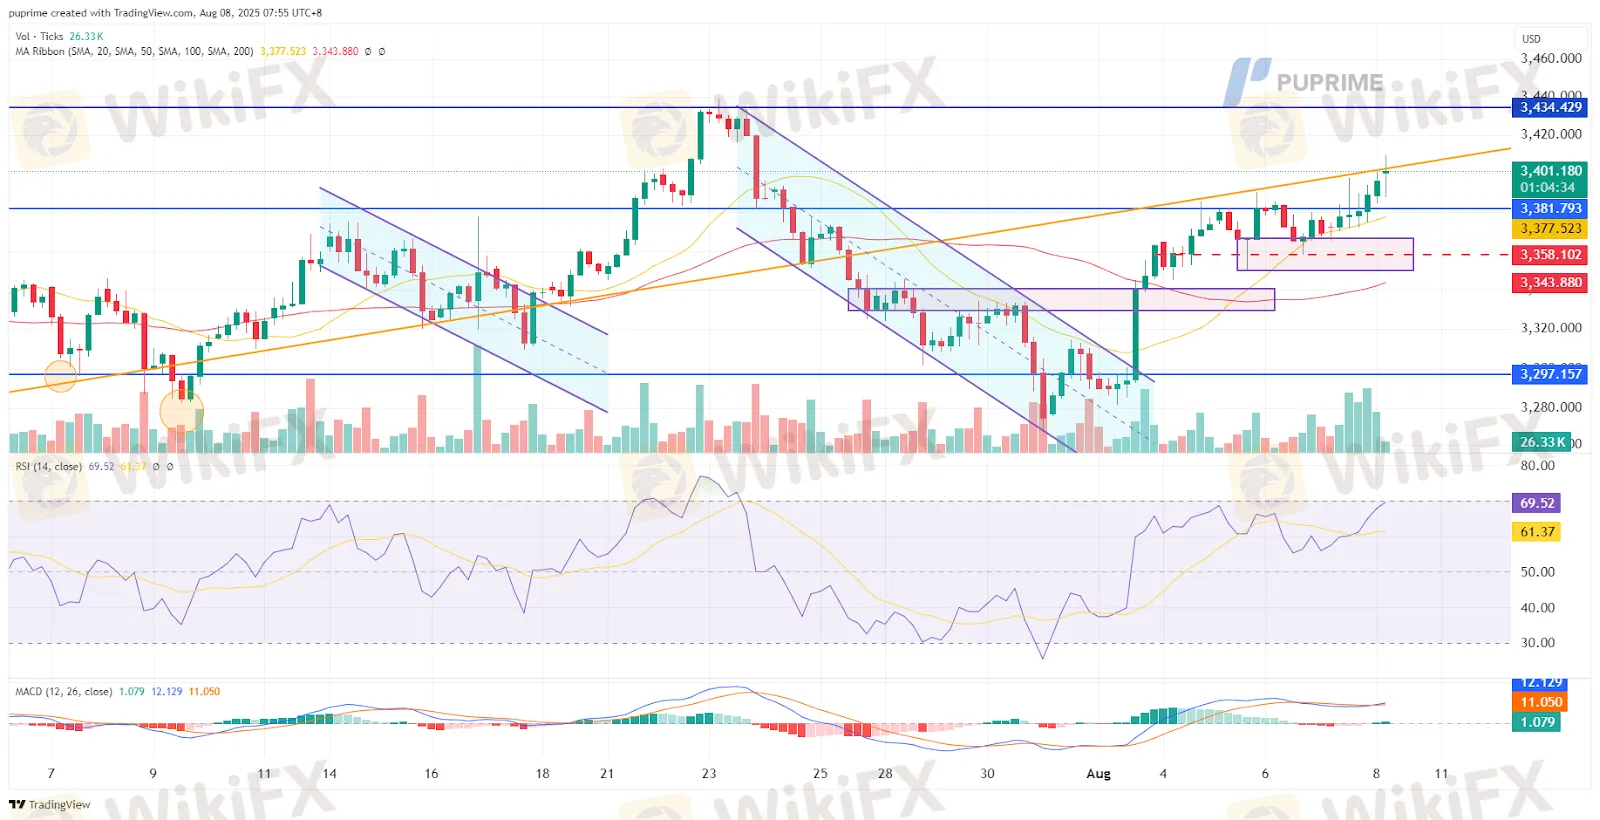
XAUUSD, H4:
Gold continued its upward trajectory in the latest session, climbing above the $3,400 mark to reach its highest level in two weeks—signaling a firm bullish bias for the precious metal. The rally, however, remains constrained below the prevailing uptrend resistance, despite the formation of a higher-high price pattern. A decisive breakout above this resistance could provide further confirmation of bullish continuation.
Traders are closely watching the critical support zone near $3,365 as a key level; a sustained break below could tilt the outlook back toward the bearish side.
Momentum indicators point toward strengthening upside pressure. The Relative Strength Index (RSI) is edging closer to the overbought zone, reflecting growing buying interest. Meanwhile, the MACD has formed a bullish crossover above the zero line, reinforcing the view that bullish momentum is gaining traction.
Unless rejected at resistance, gold appears poised to test higher levels in the near term.
Resistance level: 3434.45, 3483.75
Support level: 3382.60, 3300.00
Disclaimer:
The views in this article only represent the author's personal views, and do not constitute investment advice on this platform. This platform does not guarantee the accuracy, completeness and timeliness of the information in the article, and will not be liable for any loss caused by the use of or reliance on the information in the article.
WikiFX Broker
Latest News
D. Boral Capital agrees to a fine as a settlement with FINRA
 WikiFX
Beware of Fake RS Finance: How to Spot Scams
WikiFXFortune Wave Solution: SEC Warns of Investment Scam
WikiFXIs TD Ameritrade Safe? How to Spot Fake URLs and Stay Protected
WikiFXEngineer Loses RM230,000 in “Elite Group” Investment Scam
WikiFXIs Learning Forex Trading Online a Good Idea? Pros and Cons Explained
WikiFXTradexMarkets: 5 Troubling Signs You Shouldn’t Ignore
WikiFXA Guide to Buy Stop vs Buy Limit in Forex Trading
WikiFXSEC Implements New Rules for Crypto-Asset Service Providers
WikiFXInvestment Scam Alert: FCA Identifies 15 Scam Brokers
WikiFXCurrency Calculator

