简体中文
繁體中文
English
Pусский
日本語
ภาษาไทย
Tiếng Việt
Bahasa Indonesia
Español
हिन्दी
Filippiiniläinen
Français
Deutsch
Português
Türkçe
한국어
العربية
FPG AAPL Market Report August 8, 2025
Abstract:Apple Inc. (AAPL) experienced a strong weekly rebound, currently around 219.34 after a solid bullish breakout from a recent sideways phase. The price has surged to test a key resistance area near the
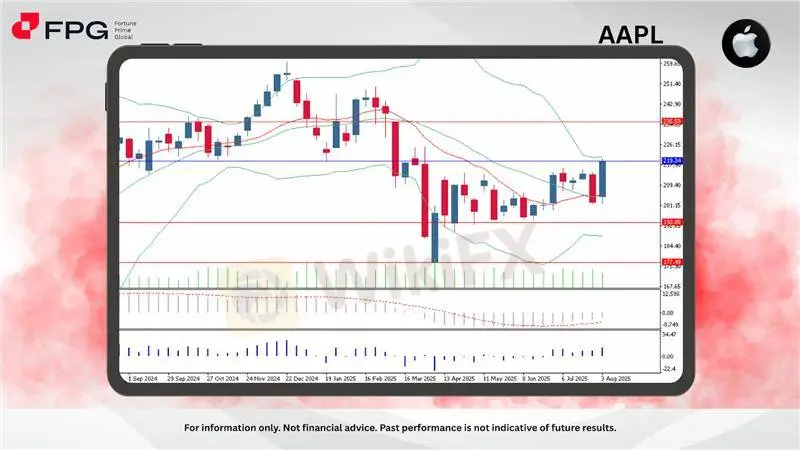
Apple Inc. (AAPL) experienced a strong weekly rebound, currently around 219.34 after a solid bullish breakout from a recent sideways phase. The price has surged to test a key resistance area near the upper Bollinger Band, hinting at a short-term bullish revival following weeks of choppy consolidation. The rally signals renewed buying interest after holding above critical support near 193.88.
AAPL formed a strong bullish weekly candle that decisively broke above the 20-week moving average and pierced the upper Bollinger Band, signaling a significant shift in market sentiment. This breakout followed several weeks of tight consolidation, suggesting that the stock has built a solid base around the 193.88 area. The rally occurred on rising volume, adding strength to the move. Price now approaches the minor resistance zone near 226.15, and a successful breakout here could pave the way toward 228 and ultimately the 235.59 high.
Indicator-wise, MACD (12,26,9) remains below the zero line at -2.453 but is showing early signs of recovery as the MACD line is curling upward and the histogram bars narrow, a precursor to a potential bullish crossover. Meanwhile, Bulls Power (13) has surged to 11.14, its highest reading in weeks, signaling strong buyer dominance in the current swing. These developments suggest the bulls are regaining control, although confirmation will depend on sustained strength above 220.
The bullish candle, positive divergence in Bulls Power, and early signs of MACD recovery combine to form a constructive momentum outlook. Although the MACD is still below zero, the improving slope hints at further upside potential if price holds above the 215 level. A break and close above 220.00–221.00 could open a path toward 228 and eventually 235.59.
Market Observation & Strategy Advice
1. Current position: AAPL traded at 219.34, with bullish breakout supported by a strong weekly candle and improving momentum signals.
2. Resistance: Immediate resistance is seen at 226.15. Beyond that, 235.59 becomes a major upside target.
3. Support: Key support rests at 193.88, followed by 177.49 as the critical floor from recent lows.
4. Indicators: MACD (12,26,9) is still in bearish territory but improving, watch for a crossover in coming sessions. Bulls Power (13) has shifted positive with strong amplitude, supporting the momentum shift in bulls' favor.
5. Trading Strategy Suggestions:
Mid-Term: Aggressive longs can be considered on sustained price above 220, targeting 228 and 235. Use tight trailing stops below 215.
Wait for Confirmation:Conservative traders may wait for MACD crossover confirmation or a retest of 215–216 zone as support.
Risk Management: Downside protection advised if price closes below 208, which would invalidate the current bullish breakout attempt.
Market Performance:
Stocks Last Price % Change
NFLX 1,180.37 +0.16%
TSLA 322.27 +0.74%
Today's Key Economic Calendar:
JP: Household Spending MoM & YoY
JP: BoJ Summary of Opinions
FR: Unemployment Rate
CN: Current Account Prel
CA: Unemployment Rate
Risk Disclaimer This report is for informational purposes only and does not constitute financial advice. Investments involve risks, and past performance does not guarantee future results. Consult your financial advisor for personalized investment strategies.
Disclaimer:
The views in this article only represent the author's personal views, and do not constitute investment advice on this platform. This platform does not guarantee the accuracy, completeness and timeliness of the information in the article, and will not be liable for any loss caused by the use of or reliance on the information in the article.
WikiFX Broker
Latest News
D. Boral Capital agrees to a fine as a settlement with FINRA
 WikiFX
Beware of Fake RS Finance: How to Spot Scams
WikiFXFortune Wave Solution: SEC Warns of Investment Scam
WikiFXIs TD Ameritrade Safe? How to Spot Fake URLs and Stay Protected
WikiFXEngineer Loses RM230,000 in “Elite Group” Investment Scam
WikiFXIs Learning Forex Trading Online a Good Idea? Pros and Cons Explained
WikiFXTradexMarkets: 5 Troubling Signs You Shouldn’t Ignore
WikiFXA Guide to Buy Stop vs Buy Limit in Forex Trading
WikiFXSEC Implements New Rules for Crypto-Asset Service Providers
WikiFXInvestment Scam Alert: FCA Identifies 15 Scam Brokers
WikiFXCurrency Calculator

