简体中文
繁體中文
English
Pусский
日本語
ภาษาไทย
Tiếng Việt
Bahasa Indonesia
Español
हिन्दी
Filippiiniläinen
Français
Deutsch
Português
Türkçe
한국어
العربية
Cooling Consumer Spending Puts Brakes on U.S. Equity Rally
Zusammenfassung:The latest Producer Price Index (PPI) report from the U.S. Bureau of Labor Statistics (BLS) shows inflationary pressures easing across the board. April‘s headline PPI rose 2.4% year-over-year, below m
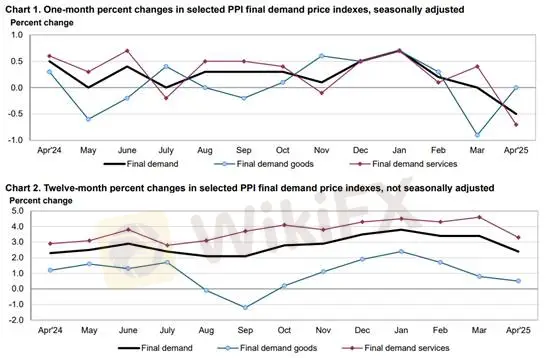
The latest Producer Price Index (PPI) report from the U.S. Bureau of Labor Statistics (BLS) shows inflationary pressures easing across the board. April‘s headline PPI rose 2.4% year-over-year, below market expectations, while the previous reading was revised sharply higher from 2.7% to 3.4%. Core PPI (excluding food and energy) for March was also revised up from 3.3% to 4.0%, with April’s figure aligning with consensus at 3.1%.

(Chart 1: U.S. PPI YoY and MoM – Source: BLS)
On a monthly basis, both headline and core PPI declined, falling by -0.5% and -0.1%, respectively. The drop was largely driven by service sector prices, particularly trade services, which plunged by 2.8 percentage points to -1.6%. Transportation, warehousing, and miscellaneous services also posted negative prints. This pushed final demand services from +0.4% down to -0.7%, offsetting modest gains in core goods and bringing the overall PPI down to its lowest level since April 2020.
The revised March figures suggest that U.S. producers indeed experienced cost pressures from tariff-related impacts, which were passed along to final goods. However, April data now reflect easing inflation, aligning with this weeks soft Consumer Price Index (CPI) release. Still, there's lingering uncertainty—will the April print be revised higher next month?
Meanwhile, the U.S. Department of Commerce reported weaker-than-expected retail sales. Not only was the prior month‘s growth revised lower, but April’s retail sales rose just 0.1%, slightly beating expectations but effectively flat.

(Chart 2: U.S. Retail Sales MoM – Source: MacroMicro)
Of the 13 subcategories, only five saw positive contributions—furniture, electronics, building and garden supplies, e-commerce, and dining. Auto and parts sales slumped from +5.54% to -0.13%. Clothing, department stores, and grocery sales also fell. The contraction in discretionary spending points to American consumers tightening their wallets, suggesting the panic-buying seen in anticipation of tariffs has faded. Overall, household spending in April slowed meaningfully.
With companies temporarily absorbing cost inflation and retail data showing consumer fatigue, U.S. equities lost momentum. Investors rotated into defensive sectors and commodities. Gold rebounded more than 1%, breaking out of a recent pullback.
Gold Technical Outlook

On the 1-hour chart, gold faced resistance at $3252 and pulled back. A sustained break below $3220 may warrant short-term bearish positions, with downside targets near the 20MA, 60MA, and support at $3195. Traders are advised to apply a stop-loss of $5–10. For bullish setups, watch for support to hold at $3195 before initiating light long positions with similar stop-loss levels.
Support: $3195, $3220
Resistance: $3252
Risk Disclaimer: The views, analysis, research, and price levels provided herein are for general market commentary only and do not represent the official stance of this platform. All readers are responsible for their own trading decisions. Please exercise caution.
Haftungsausschluss:
Die Ansichten in diesem Artikel stellen nur die persönlichen Ansichten des Autors dar und stellen keine Anlageberatung der Plattform dar. Diese Plattform übernimmt keine Garantie für die Richtigkeit, Vollständigkeit und Aktualität der Artikelinformationen und haftet auch nicht für Verluste, die durch die Nutzung oder das Vertrauen der Artikelinformationen verursacht werden.
WikiFX-Broker
Aktuelle Nachrichten
Bundeswirtschaftsministerium arbeitet an Konzept für Industriestrompreis – Medienbericht nennt rund vier Milliarden Euro Kosten
Kernstaaten des Ölkartells Opec weiten Fördermenge erheblich aus
Wechselkursberechnung


